The Effectiveness of Breath Care on Low-Carb Oral Malodor
The low carb craze also indicates more emphasis on oral home care.
The low carb diet craze has brought with it an unexpected side effect - bad breath. Called low carb oral malodor (LCOM), it is caused by the breakdown of food that produces volatile organic compounds (VOCs) and from bacteria on oral tissue. To find solutions, a group of colleagues from the University Health Resources Group, Inc. and the University of Minnesota’s Clinical Dental Research Center conducted a study to evaluate the effectiveness of a breath care system on people with LCOM.
The supermarket shelves are full of products for people who have been swept up in the low carb diet craze. Has sacrificing the morning bagel been worth it? The Atkins and similar diets require eating high amounts of protein and fat, which risks nutritional deficits and other side effects. These diets have been criticized by those who believe that the most efficient way to lose weight is through a well-balanced diet low in saturated fats, coupled with an active lifestyle.
The low carb craze began with an overweight middle-aged man who was having trouble losing weight and happened upon a low-carb diet. Surprisingly it worked, and he wrote a book, Letter on Corpulence, Addressed to the Public, by William Banting, in 1863.
Dr. Robert Atkins revived these theories in the 1970s, and there has been a resurgence of low carb dieting, with little scientific evidence to support the safety of the diets. Since 1980, the number of overweight U.S. adults age 20 and older increased from 46 to 65 percent. Americans spend $33 billion a year on weight loss solutions, and 37 percent of people diet at any given time.
Low carb diets can lead to LCOM. This potentially embarrassing condition may be experienced sporadically and at different degrees depending on how strictly the diet is followed, previous disposition for the condition, and oral hygiene. High protein diets cause more VOCs, and when carbs are decreased, the body turns to ketones that are produced by burning fat. Ketoses build up, and VOCs are expelled through the breath, which produces an offensive odor.
How would a high-protein, low carb diet contribute to oral malodor? Is the malodor associated with the diet temporarily, or does it develop into a chronic problem? Most subjects benefited from treatment and noticed significantly fresher breath. Results showed that control groups also experienced fresher breath, which was most likely attributed to the increased awareness of the condition, which led to a more rigorous dental hygiene regimen.
LCOM is not likely caused by the passage of dietary proteins through the mouth, as there are not sufficient enzymes to degrade proteins to the peptides for use by odor-causing bacteria. Rather, it is theorized that high-protein diets increase the levels of peptides and amino acids in the serum, which increases saliva. Although not yet documented in humans, high protein diets increase the levels of urea in the saliva of animals. If there are increased peptides in the saliva, they will be readily available for the odor causing bacteria to use them. In order for a low carb diet to be responsible for oral malodor, the body would experience an increase in serum peptide and amino acid levels.
Low carb diets favor loss of fat, but water may account for some of the initial rapid weight loss. This causes dry mouth that can contribute to bad breath. During prolonged fasting or adherence to a strict low carb diet, the metabolism shifts toward lipid breakdown as the energy source, resulting in ketone bodies in the liver. Clinically, ketone body production indicates that lipid metabolism has been accelerated, and the ketone bodies serve as alternative fuel for tissues to spare carbohydrate and protein, and ketosis suppresses appetite to help keep weight off.
Brushing, tongue scraping and rinsing as part of the BreathRx® treatment kit proved to be beneficial to those subjects who experienced LCOM, as well as chronic OM. Saliva contains many nutrients that can be fermented to VSCs and other noxious compounds, particularly if the subjects are on a high-protein diet. When the saliva settles in the crevices on the tongue and around the teeth for extended periods, OM can occur. The treatment kit used in the study allowed for the mechanical removal of settled saliva, as well as rinsing and expelling. During the study, some people did not experience improved breath. This may be the result of chronic halitosis that is characteristic of systemic diseases such as diabetes mellitus, chronic renal failure, anaerobic infections, acid reflux and xerostomia, as well as subject non-compliance.
Results from the study show that beneficial results were attained with all groups under treatment in a relatively short time with the use of the breath management starter kit, BreathRx.
The authors are affiliated with University Health Resources Group, Inc., in Culver City, Calif. The corresponding author is Sushma Nachnani, PhD, and she can be contacted at [email protected].
References
1. Greenman J, Duffield J, Spencer P, Rosenberg M, Corry D, Saad S, Lenton P, Majerus G, Nachnani S, El-Maaytah M.
Study on the organoleptic intensity scale for measuring oral malodor. J Dent Res. 2004;83(1):81-5.
2. Young A, Jonski G, Rolla G. Combined effect of zinc ions and cationic antibacterial agents on intraoral volatile sulphur compounds (VSC). Int Dent J. 2003;53(4):237-42.
3. Nachnani S. Oral Malodor: A Brief Review CDHA Journal 1999; 14 (2): 13-15.
4. Survey conducted at ADA reveals interesting trends. Dent Econ 1995;6.
5. Preti G, Clark L, Cowart BJ et al. Non oral etiologies of oral malodor and altered chemosensation. J Periodontol 1992; 63 (9): 790-6.
6. Rosenberg M. Clinical assessment of bad breath: current concepts J Am Dent Assoc. 1996; 127(4): 475-82.
7. Touyz LZ. Oral Malodor--a review. J Can Dent Assoc. 1993; (7): 607-10.
8. Rosenberg M, Editor. Bad Breath: research perspectives. Ramot Pub. Tel Aviv, 1995.
9. Tonzetich J. Production and origin of oral malodor: a review of mechanisms and methods of analysis. J Periodontol, 1977;28:13-20.
10. Yaegaki K, Sanada K. Biochemical and clinical factors influencing oral malodor in periodontal patients. J Periodontol, 1992; 63: 783-89.
11. Clark G, Nachnani S, Messadi D, CDA Journal 1997;25:2.
12. Waler S. On the transformation of sulfur-containing amino acids and peptides to volatile sulfur compounds (VSC) in the human mouth. Eur J Oral Sci. 1997;105 (5 pt 2): 534-7.
13. Yaegaki K, Sanada K.: Volatile sulfur compounds in mouth air from clinically healthy subjects and patients with periodontal disease. J Periodont Res 1992; 27:223-238.
14. Rosenberg M, Septon I, Eli I, Bar-Ness A, Gelenter, I Bremer, S Gabbay. Halitosis measurement by an industrial sulfide monitor. J Periodontol. 1991;62:487-489.
15. Rosenberg M, Kulkarni GV, Bosy A, McCulloch CAG: Reproducibility and sensitivity of oral malodor measurements with a portable sulfide monitor. J Dent Res 1991; 11:1436-1440.
16. Spielman AL, Bivona P, Rifkin BR. Halitosis: A common oral problem. N.Y. State Dent J 1996;63(10): 36-42.
17. Nachnani S, The effects of oral rinses on halitosis. CDA Journal,1997;25.
18. Westman EC, Yancy WS, Edman JS, Tomlin KF, Perkins CE. Effect of a 6-month adherence to a very low carbohydrate diet program. Am J Med, 2002; 113:30-36.
19. Blackburn GL, JC, Morreale S. Physician’s guide to popular low-carbohydrate weight-loss diets. Cleve Clin J Med, 2001; 68:761-774.
20. Rabast U, Kasper H, Schonborn J. Comparative studies in obese subjects fed carbohydrate-restricted and high carbohydrate 1,000-calorie formula diets. Nutr Metab, 1978; 22:269-277.
Editor’s Note: The following contains more information about the study conducted prior to the writing of the preceding article on oral malodor and “low-carb” diet plans.
Methods and materials
For this random study, 54 people were enrolled in two categories: groups 1and 2 received treatment, and groups 3 and 4 were the control groups. Group 1 consisted of subjects with oral malodor (OM) who were not on low-carb diets. Group 2 consisted of subjects with LCOM. Both were treated with a breath care management starter kit called BreathRx that included toothpaste, tongue spray and scraper, and mouth rinse. They were told to use the products in three steps. First, subjects brushed with the toothpaste. Second, they sprayed the back of their tongues and immediately followed with the tongue scraper. Third, they swished with the mouth rinse for 30 seconds. They were instructed to use the products twice a day for six weeks.
The experimental procedure included a screening process, clinical examinations, and OM diagnostic parameters. Each person signed an informed consent statement, and completed a health and dental hygiene habit questionnaire. The dental hygiene habit questionnaire asked the participants to self-assess OM under 12 conditions, including physical, mental, and temporal circumstances.
Final eligibility for the study was determined by several criteria. Subjects were screened for good health, at least 18 years of age, willingness to comply with protocol procedures, an OJ score of at least three on a five-point scale, and a minimum of 16 natural teeth including four molars. Individuals underwent oral soft tissue assessment and were disqualified if they met any of the exclusion criteria. These included gross oral pathoses, orthodontic devices, dentures, systemic diseases, concomitant drug therapy, pregnant or lactating, periodontal disease or gross oral hygiene neglect, smoker, prophylactic antibiotic coverage for routine dental therapy, or using systemic antibiotics immediately before the study.
The subjects were instructed not to brush, rinse, eat or drink anything except water, use dental products, or wear fragrances two hours prior to the appointment. This ensured stable oral odor during baseline and follow-up evaluations. The OM parameters included organoleptic judges (OJs), the Halimeter®, and a spoon test. For the organoleptic assessment test, two trained OJs made independent evaluations on each subject. OJs were trained based on an OM training program designed by University Health Resources Group, Inc. and the University of Minnesota, Clinical Dental Research Center. Each subject was instructed to close his mouth for two minutes without swallowing. The subject then breathed out gently, ten centimeters from the OJ’s nose, for the assessment according to the five-point OM scale: 1 - None; 2 - Faint; 3 - Moderate; 4 - Strong; 5 - Extremely strong.
The balanced Halimeter instrument was used for all measurements to assess the mouth, throat and posterior tongue regions. For the Halimeter reading in the mouth, one end of a drinking straw was attached to the instrument, and the other end was inserted approximately one-half inch into the subject’s mouth, with the lips gently touching the straw. The subject was instructed to breathe through the straw until a volatile sulfur compounds (VSC) reading was reached and recorded.
For the spoon test, the back of the tongue was scraped with a plastic spoon. An OJ assessed the odor after five seconds, 10 centimeters from his or her nose, according to the five-point scale.
Results and statistical analysis
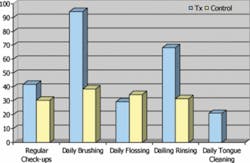
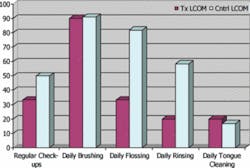
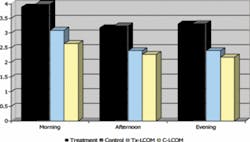
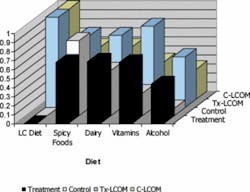
There were more males in all groups. However, there was a higher number of females in the LCOM groups, supporting the idea that women are more prone to dieting than men (Table 1). All groups had consistent age, height, and weight and brushed their teeth regularly, but did not practice consistent use of a tongue cleaner. This suggests that tongue cleaning is an important issue to address when investigating the causes of OM (Figure 1). Individuals reporting regular dental check-ups and regular flossing ranged between 30 and 40 percent in all groups, with a higher percentage of individuals rinsing in the OM treatment groups (70 percent) than the LCOM treatment groups (20 percent). This is reasonable considering that OM is a chronic condition, whereas LCOM is transitory, correlating to why the LCOM groups do not have mouth-rinsing regimens. Groups with LCOM had a lower self-assessment of their level of OM throughout the day, suggesting that OM is less severe in transitory cases compared to chronic cases (Figure 2). LCOM groups consumed more dairy and vitamins. For all groups, about half of the subjects reported consuming alcohol on a regular basis, and about three-quarters reported consuming spicy foods regularly (Figure 3).
Means were compared using one-way analysis of variable methods. The non-parametric distributions/medians were compared using the Kruskal-Wallis (KW) test based on ranks. The KW test is the same as the Wilcoxon rank sum test. Since the organoleptic score is only semi-continuous, the non-parametric KW p-value is more appropriate. Generally, the nonparametric KW approach is more conservative because it does not assume a Gaussian (normal) distribution.
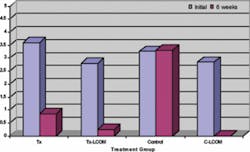
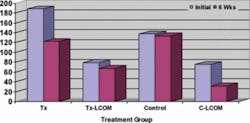
For OJ results (Figure 4), the statistically significant difference between the OM and control groups was -2.800 (p< 0.001), and the mean difference between the LCOM and control groups was -2.673 (p< 0.001) (Table 2). Similar results (p= 0.000) were obtained using the non-parametric KW test for both groups. For the Halimeter( test (Figure 5), the mean difference between the OM and control groups was -47.920 (p=0.047). The difference between the low carb and control groups was -16.190 (p= 0.500). Similar results were obtained with the KW test. For the spoon test, mean difference for the OM group and the control group was -2.140 (p <0.001). Mean difference for the low carb and control group was -1.5714 (p=0.0012).

